
To view the project overview, follow the steps below.
-
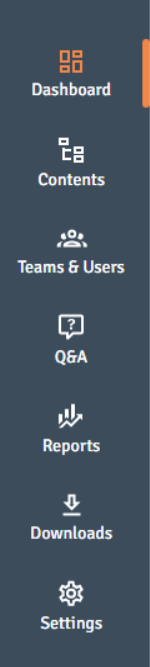
Access Dashboard: Click 'Dashboard' on the top left of the side navigation panel.
-
Data Sections: Find different information in the project's panels:
-
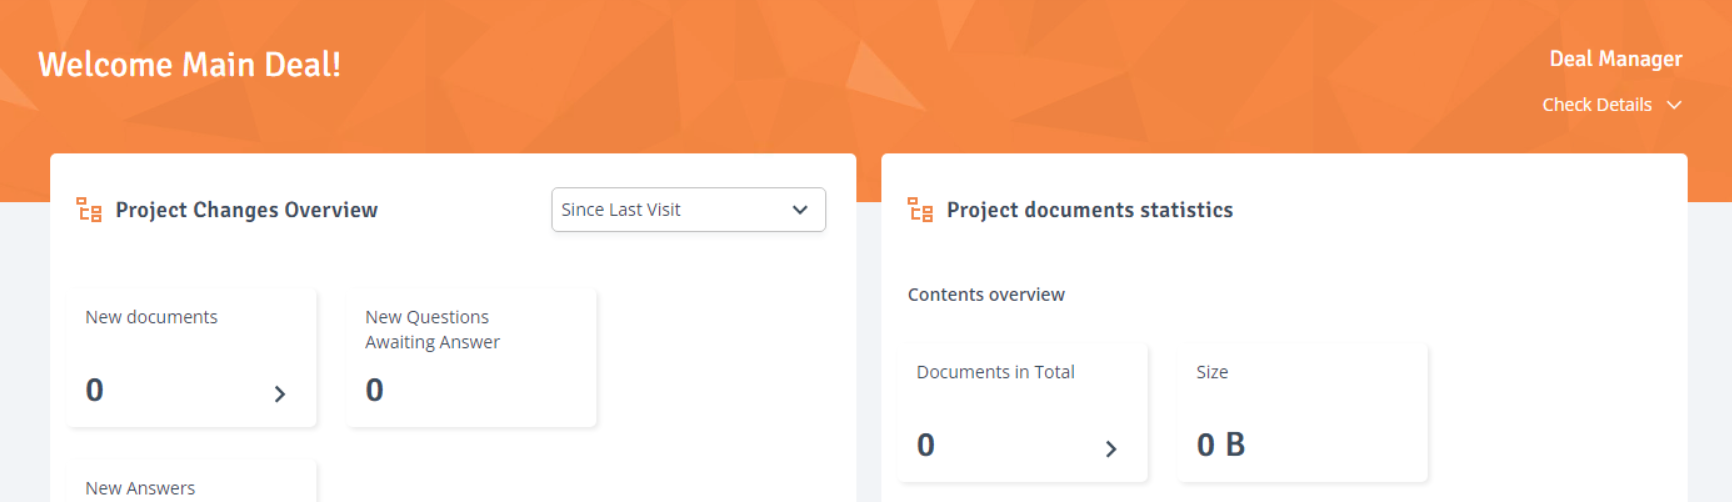
Project Changes Overview: This section provides an overview of any changes in the project since your last visit. Filter options allow you to view changes from the past 24 hours or 7 days.
-
New Documents: Provides the total number of new documents added to the project.
-
New Questions Awaiting Answer: Provides the total number of new questions to be answered.
-
New Questions Awaiting Approval: Provides the total number of new questions to be approved.
-
New Answers Awaiting Answer: Provides the total number of new answers to be approved.
-
New Answers: Provides the total number of new answers provided.
-
-
Project Document Statistics: This section provides an overview of the project's content.
-
Documents in Total: Provides the total number of documents in the project.
-
Size: Provides the combined size of project documents in B.
-
Documents in Bin: Displays the number of documents currently in the project bin.
-
Documents Pending Conversion: Provides the total number of files converted, processing, and failed.
-
Online Pages: Displays the current count of online pages.
-
Not Converted Files Size: Provides the combined size in B of the project documents that have not been converted.
-
Top Most Viewed Documents: Lists the most viewed documents, sorted by the number of views.
-
-
Project Analytics: This section provides an overview of the project's most important analytics in the form of a graph.
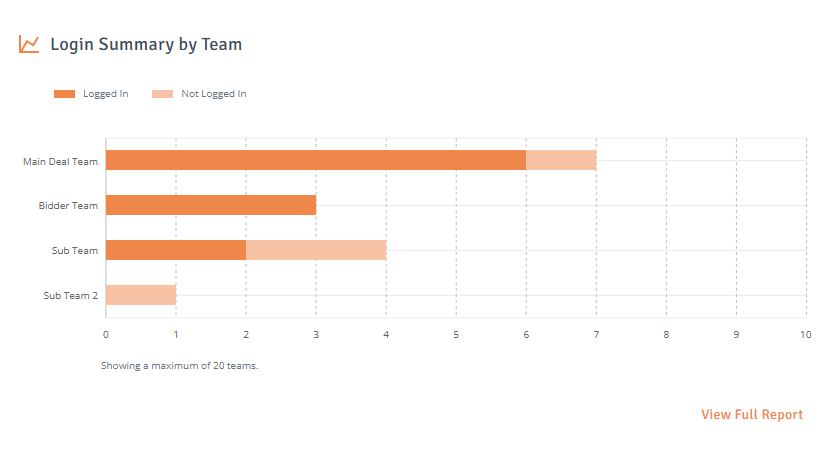
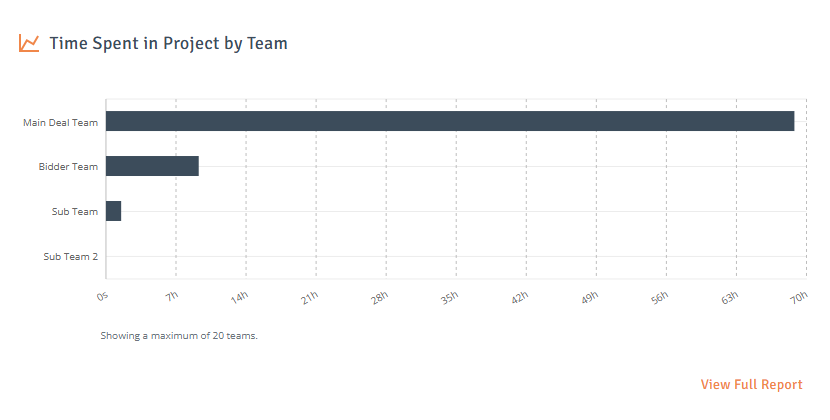
The graphs display up to 20 teams or users at a time. To view the complete report in table format, select ‘View Full Report’ in the bottom-right corner of the tile. This will take you to the ‘Reports' tab.
To view details, hover your mouse over any bar in the graph to see the total count. For a more detailed breakdown, click the bar to open the corresponding information in the 'Reports’ tab.-
Document Activity by Team: Provides the total number of document views and downloads per team, offering valuable insights into team activity.
Use the time range filter dropdown in the top-right corner to adjust the data shown, for example, ‘Since Live’, ‘Since Last Visit, 'Last 24 Hours', or a 'Custom Date Range’.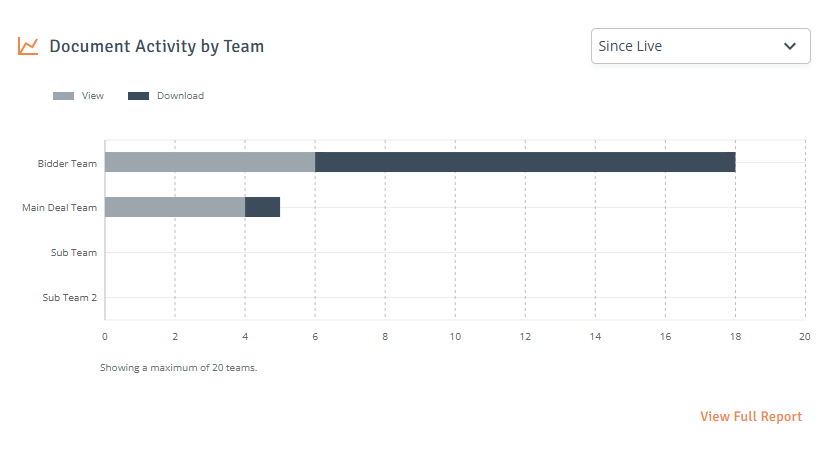
-
Document Activity by User: Provides the total number of document views and downloads per user, offering valuable insights into user activity. Use the Team Dropdown on the left to select the team whose users you want to view.
Use the time range filter dropdown in the top-right corner to adjust the data shown, for example, ‘Since Live’, ‘Since Last Visit, 'Last 24 Hours', or a 'Custom Date Range’.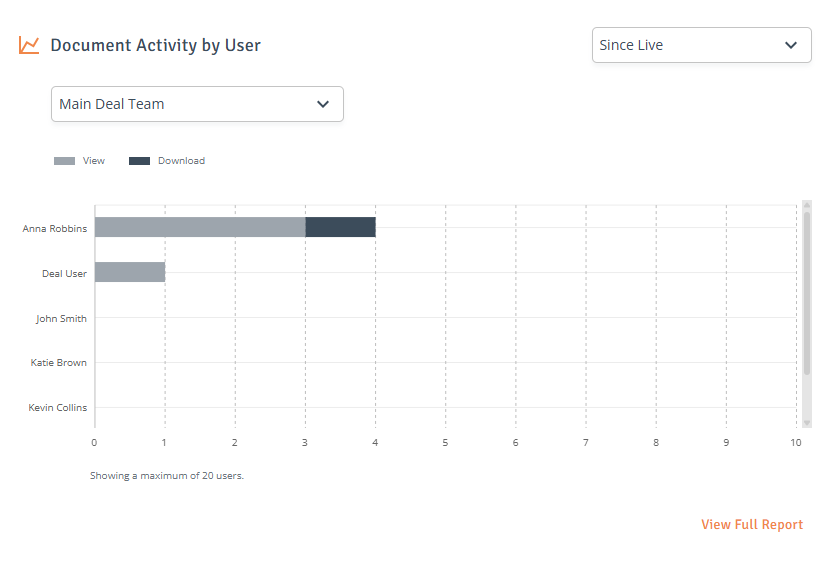
-
Login Summary by Team: Displays the total number of users who have logged in and those who have not logged into the project yet. The data is shown per team, providing insight into overall participation.
-
Time Spent in Project by Team: Displays the total time the team has spent in the project so far. The data is shown per team, providing insight into overall engagement.
-
-